Plug & Play
Live in 2 steps
Mount the sensor, turn it on—and see it immediately in Envira. No configuration, no middleware.
Step 01
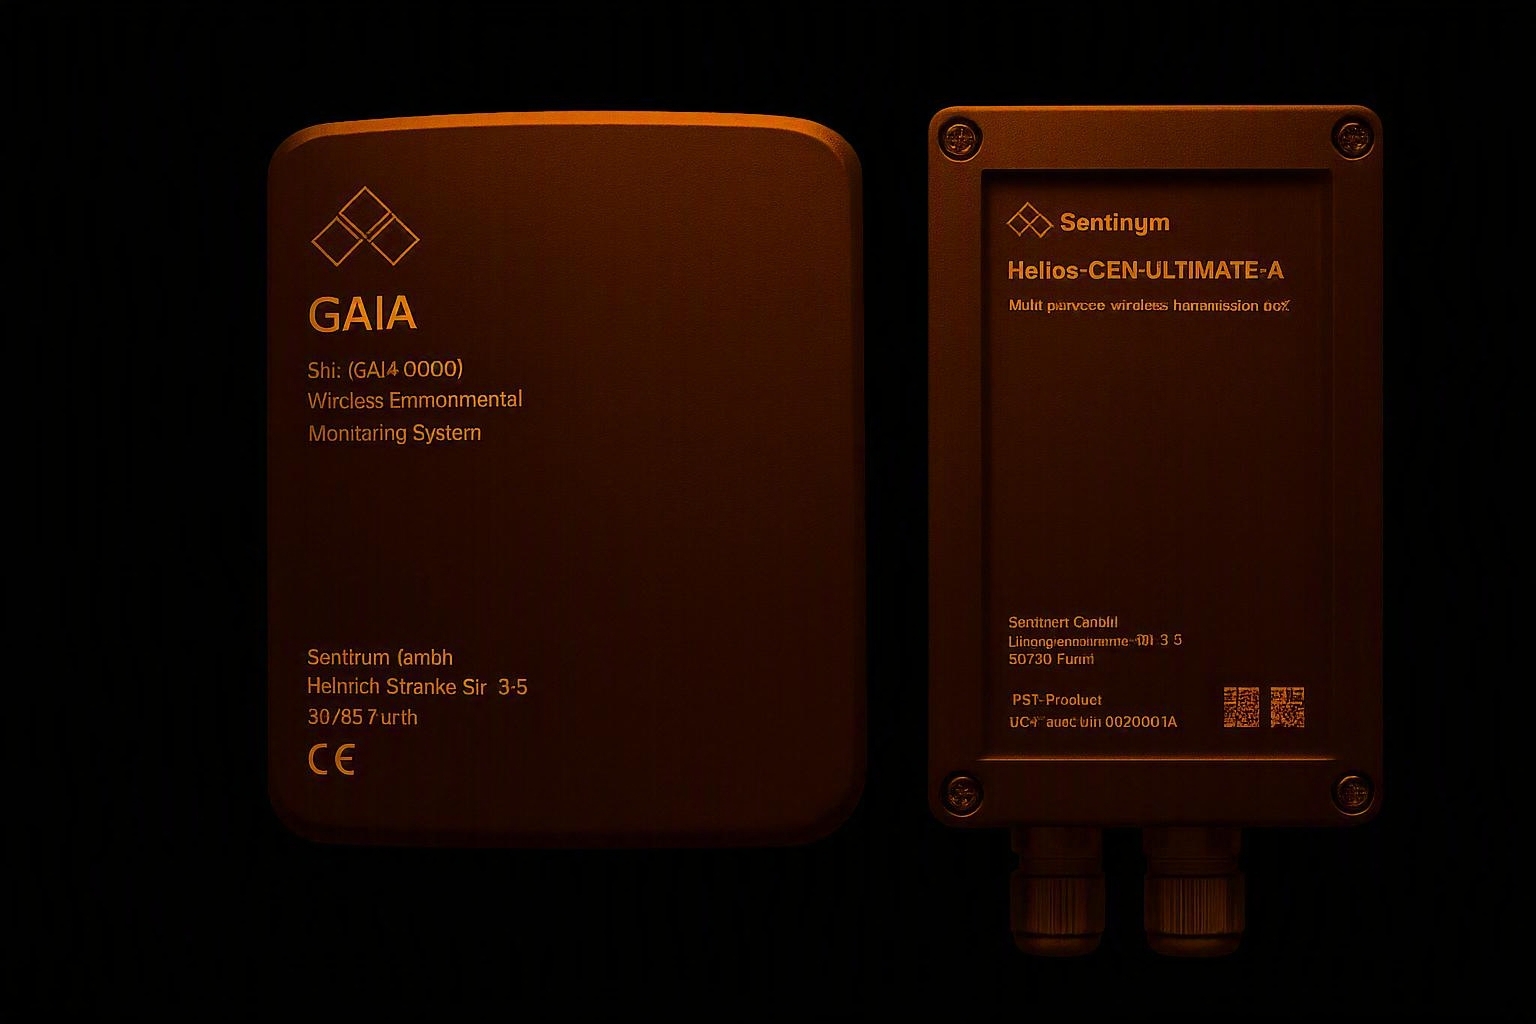
Sensor: GAIA or Helios
Rugged outdoor devices with LoRaWAN, Mioty, or NB-IoT. Unpack, mount, turn on—automatically send all environmental parameters to Envira.
Discover devices →
Step 02
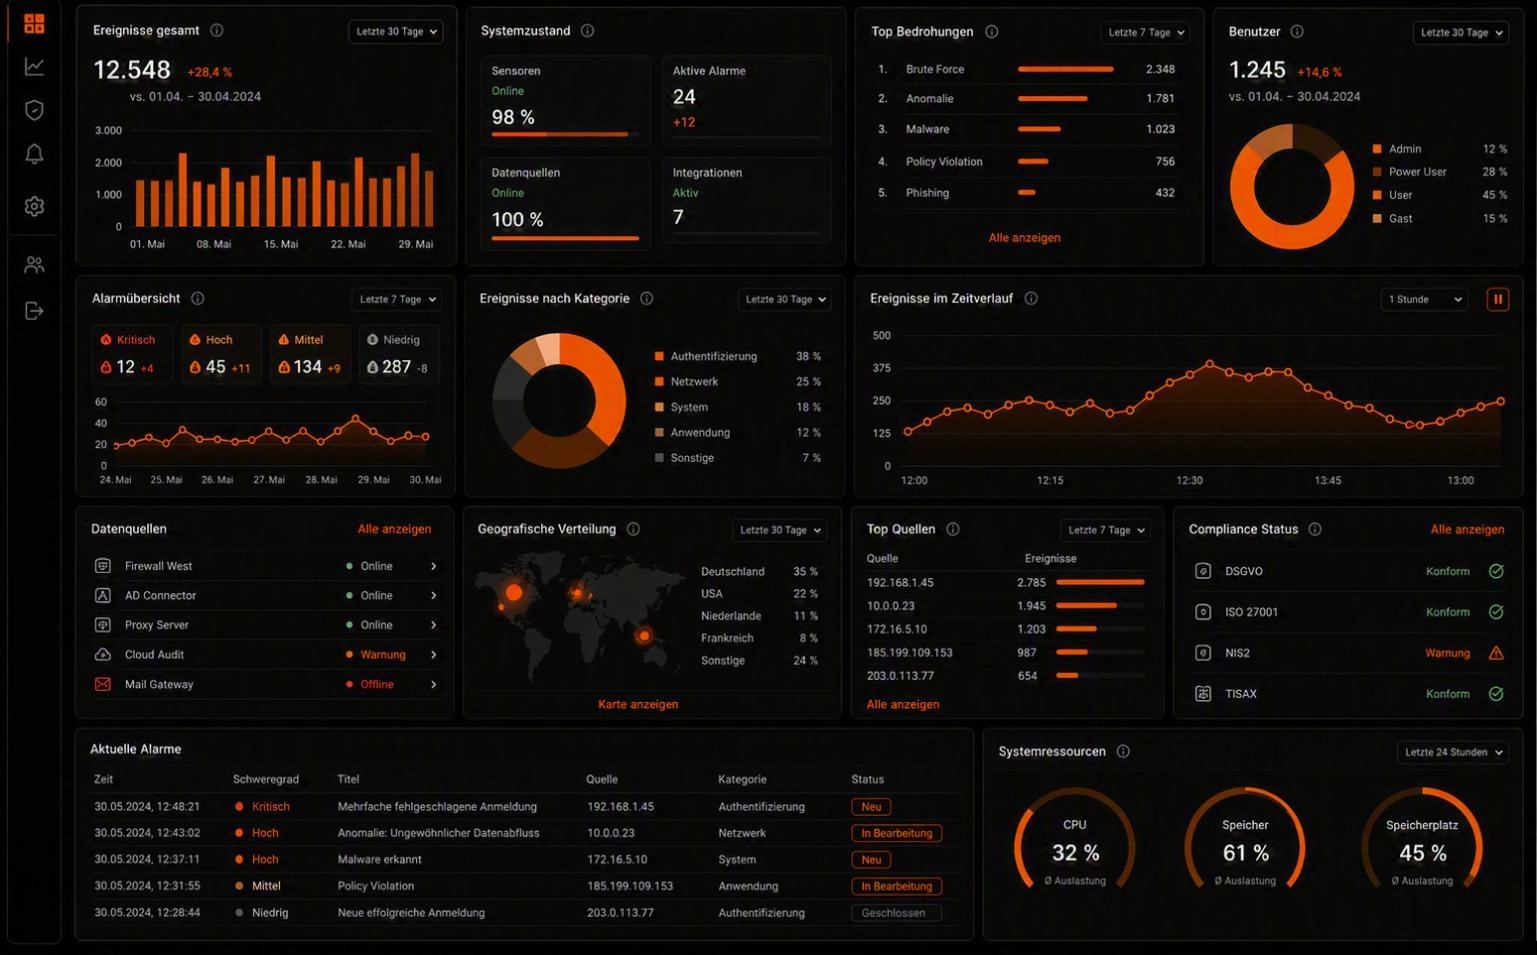
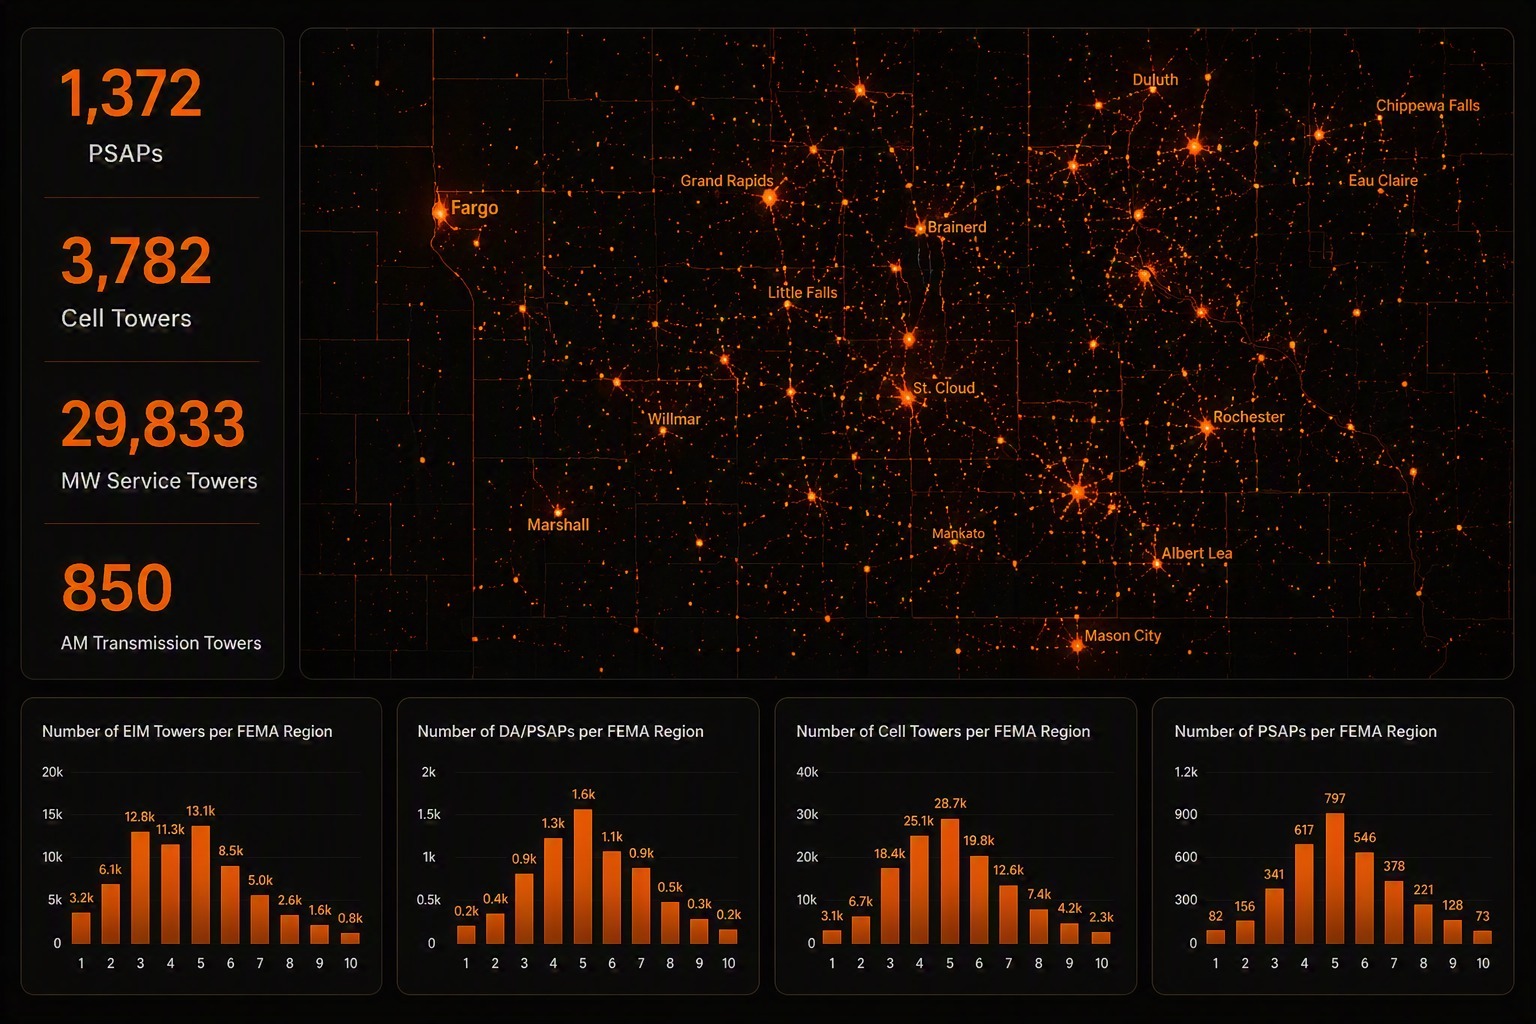
Monitor: Envira Web App
Log in via your browser – maps, live data, charts, and alerts are immediately available. No app download, no setup, no installation.
Open Envira →